A legal compliance report
Skematic
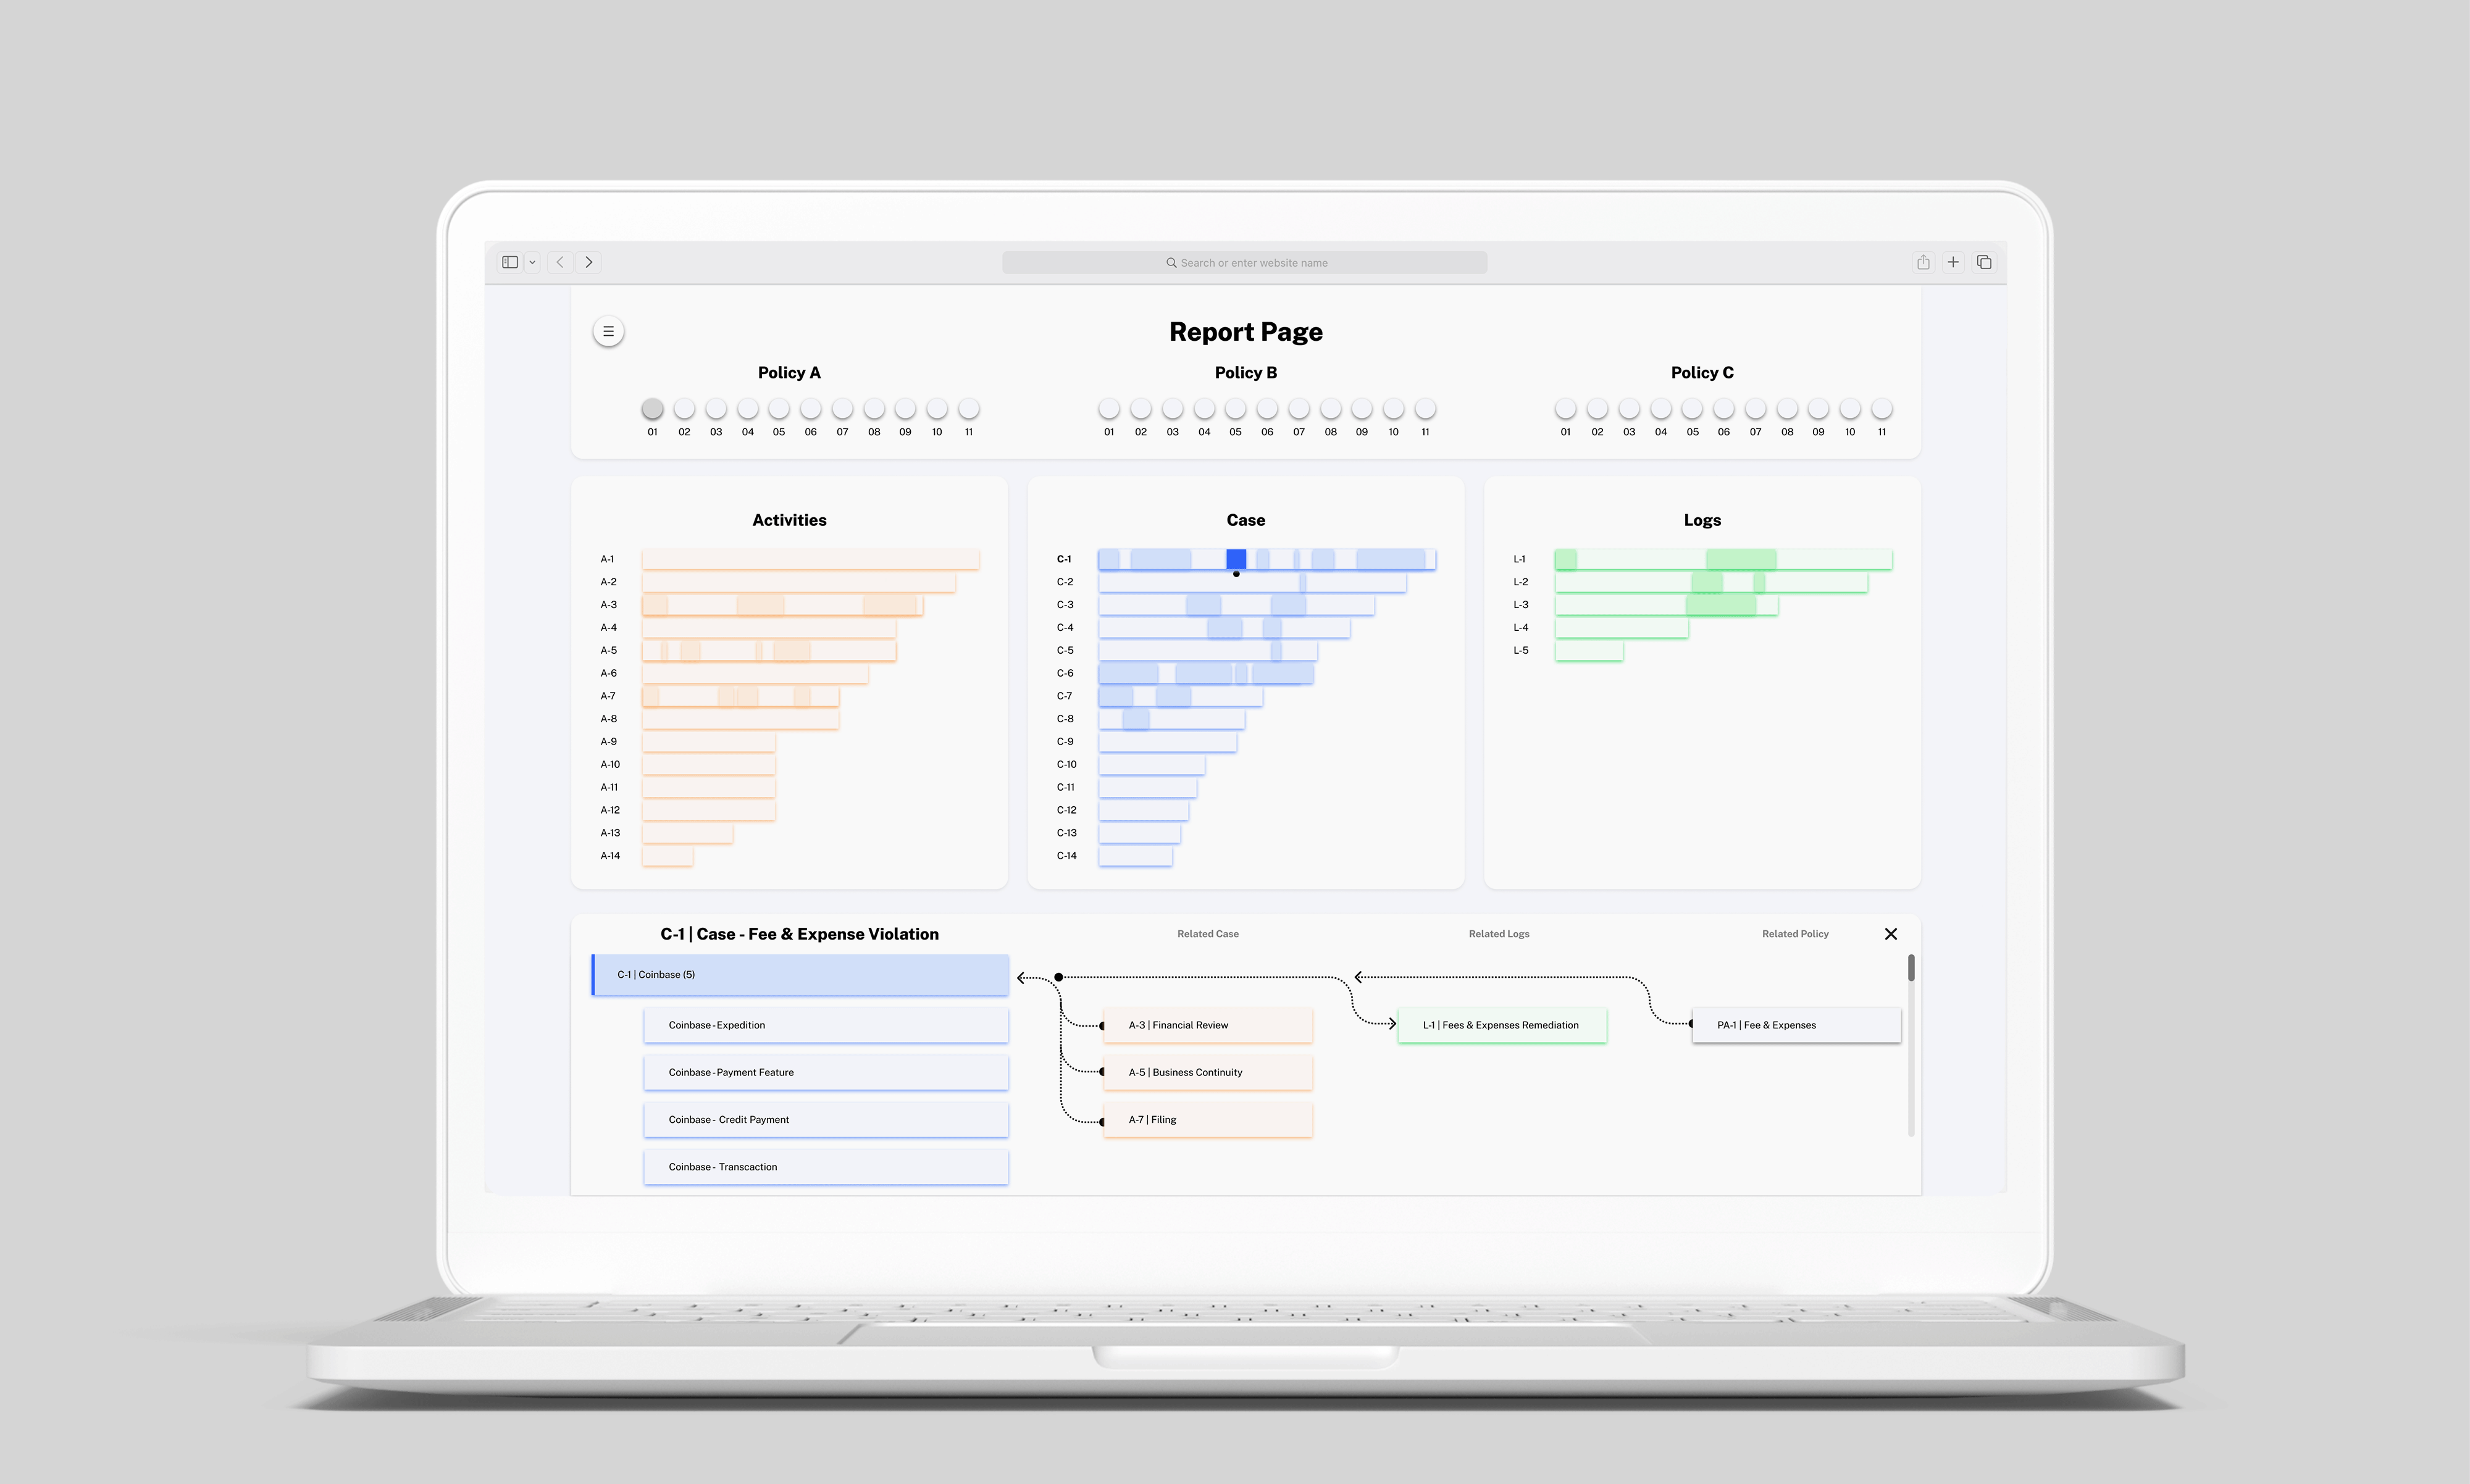
This web app ensures the legal compliance of financial and fintech products. The task was to design a report page that provides lawyers with an overview of ongoing work and highlights where their attention is focused. The main challenge was simplifying complex data structures into clear, intuitive visualizations and navigation.
Experience Design | Ideation | Information Architecture | Prototyping
Role:
Product Designer
Team:
1 Developer
Time:
2023
Report page
Visualizing complex information structures
Context & Challenges
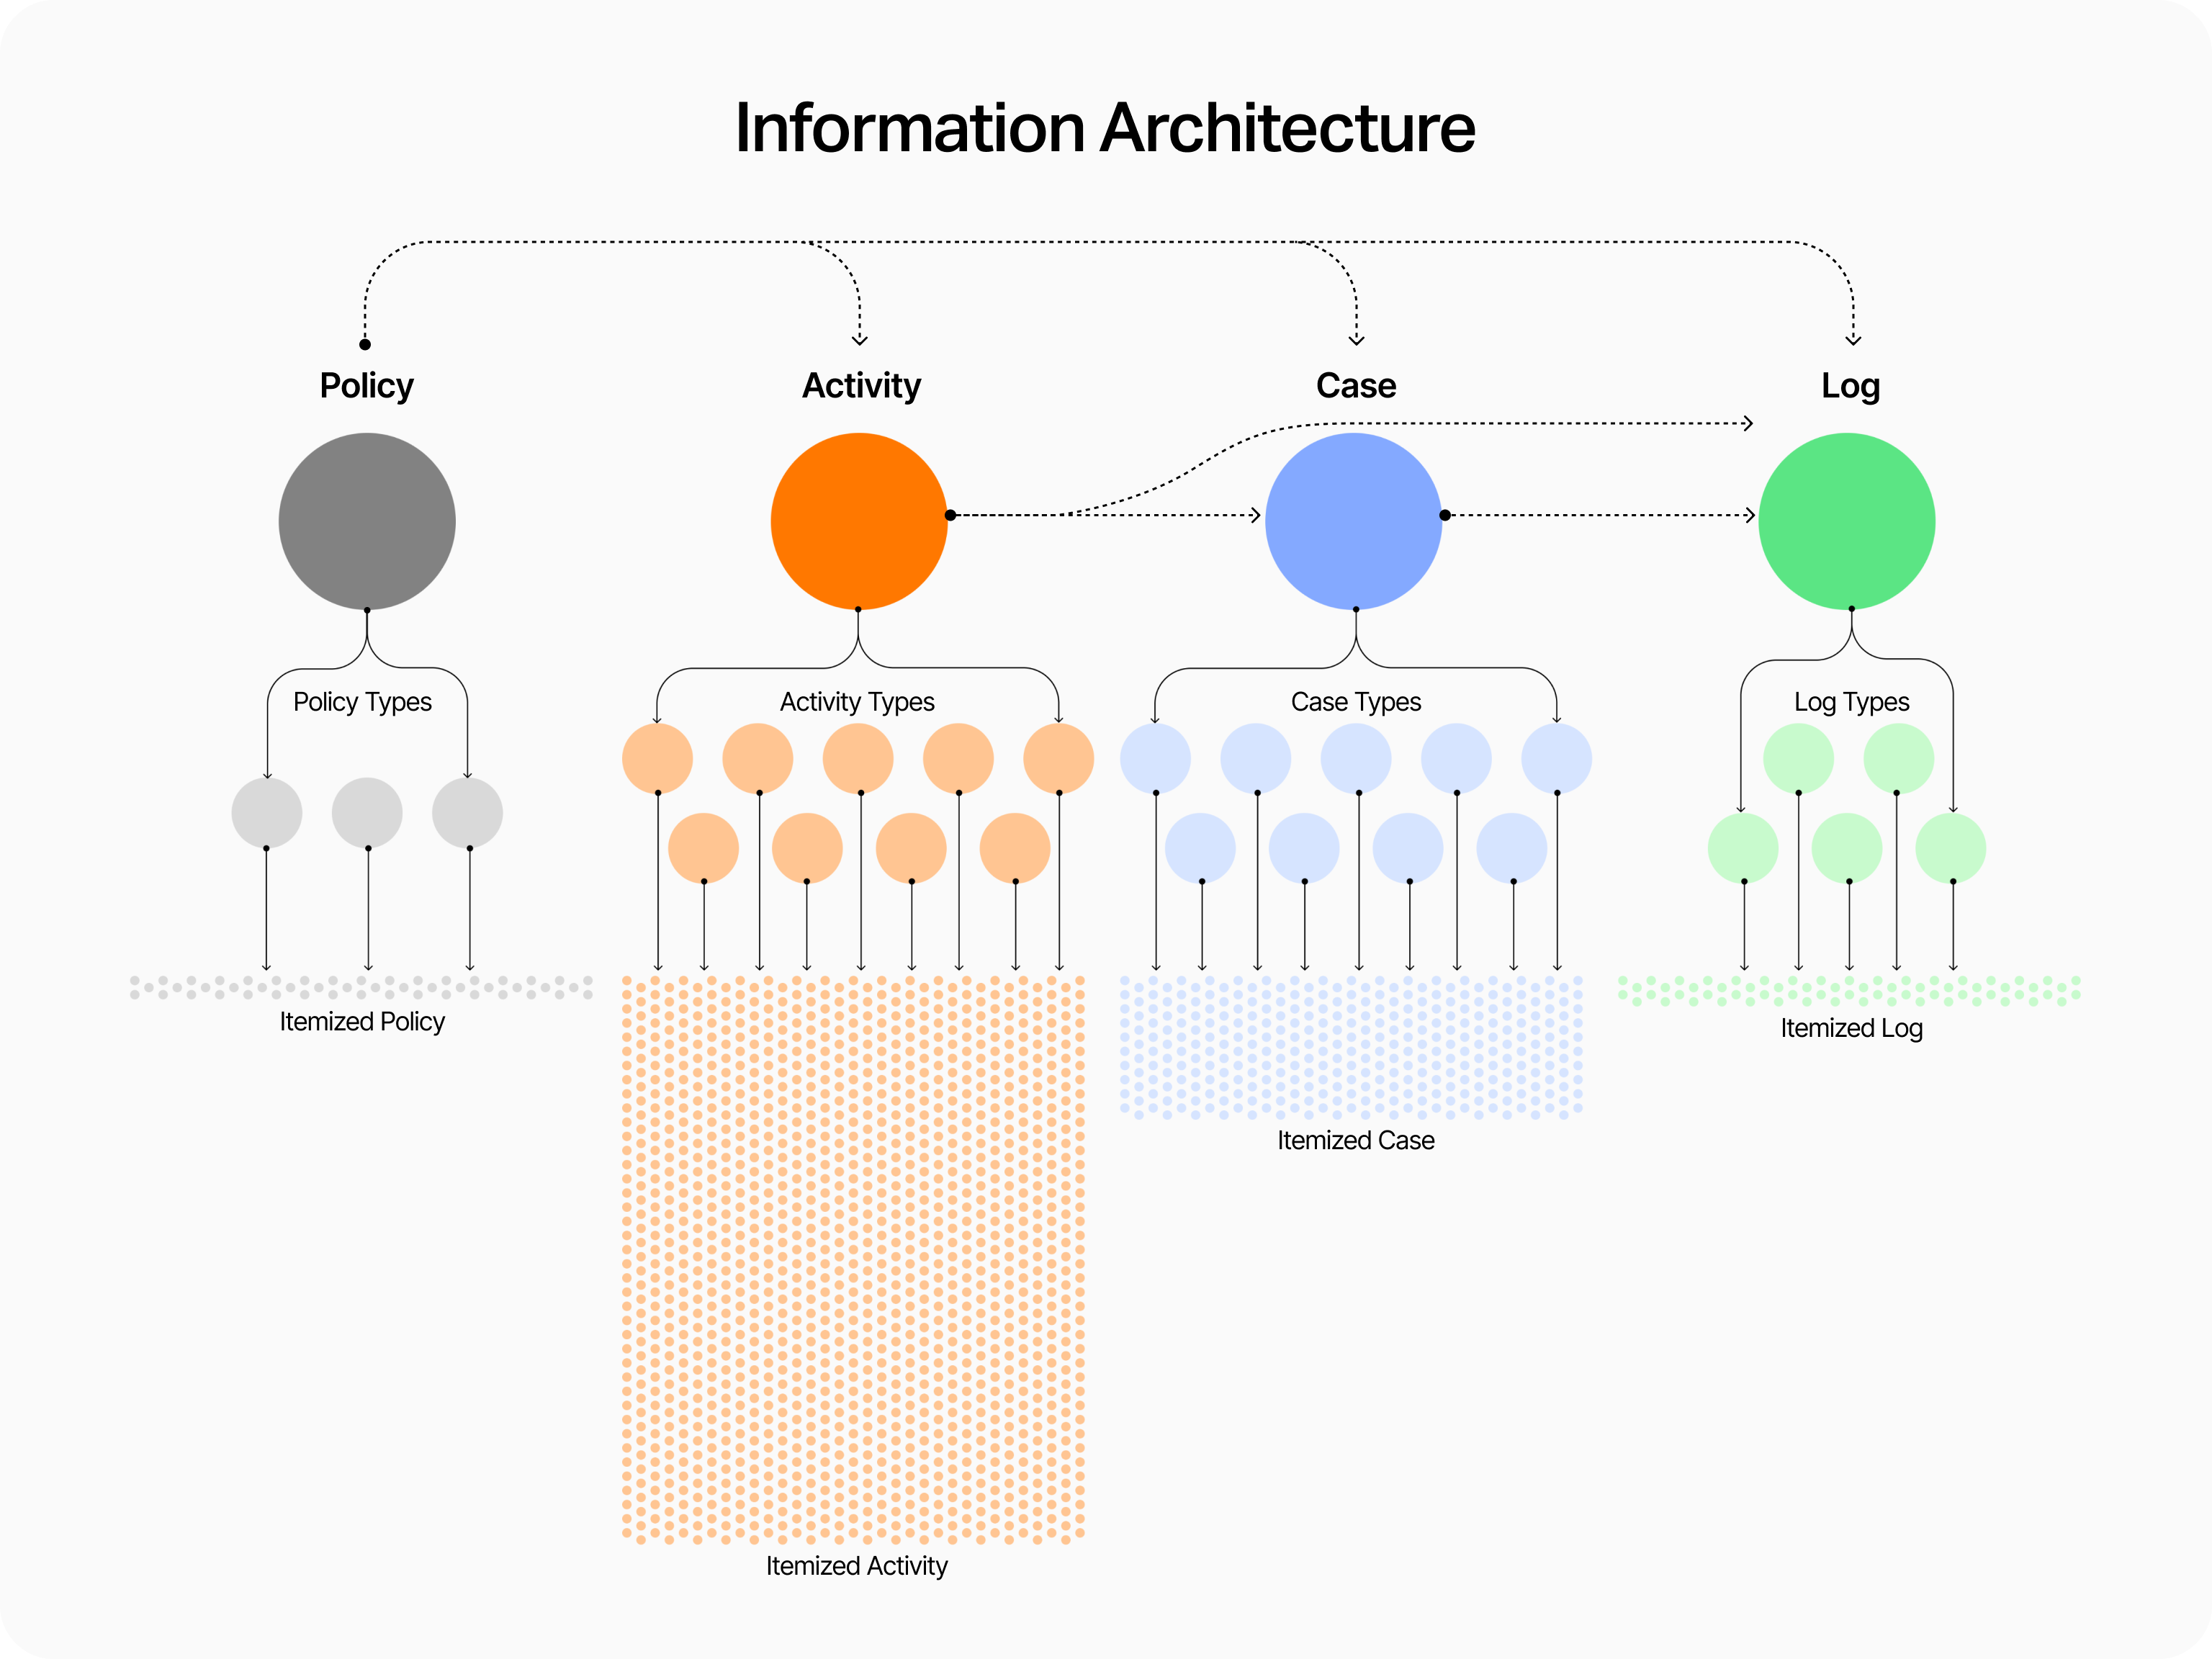
The existing application organizes compliance data into four key components: Policies, Activities, Cases, and Logs. Here's how they work together:
Policies define the rules and criteria for Activities, Cases, and Logs. Activities are actions or events that occur within Cases or Logs. Cases are ongoing projects. Logs are completed cases.
01
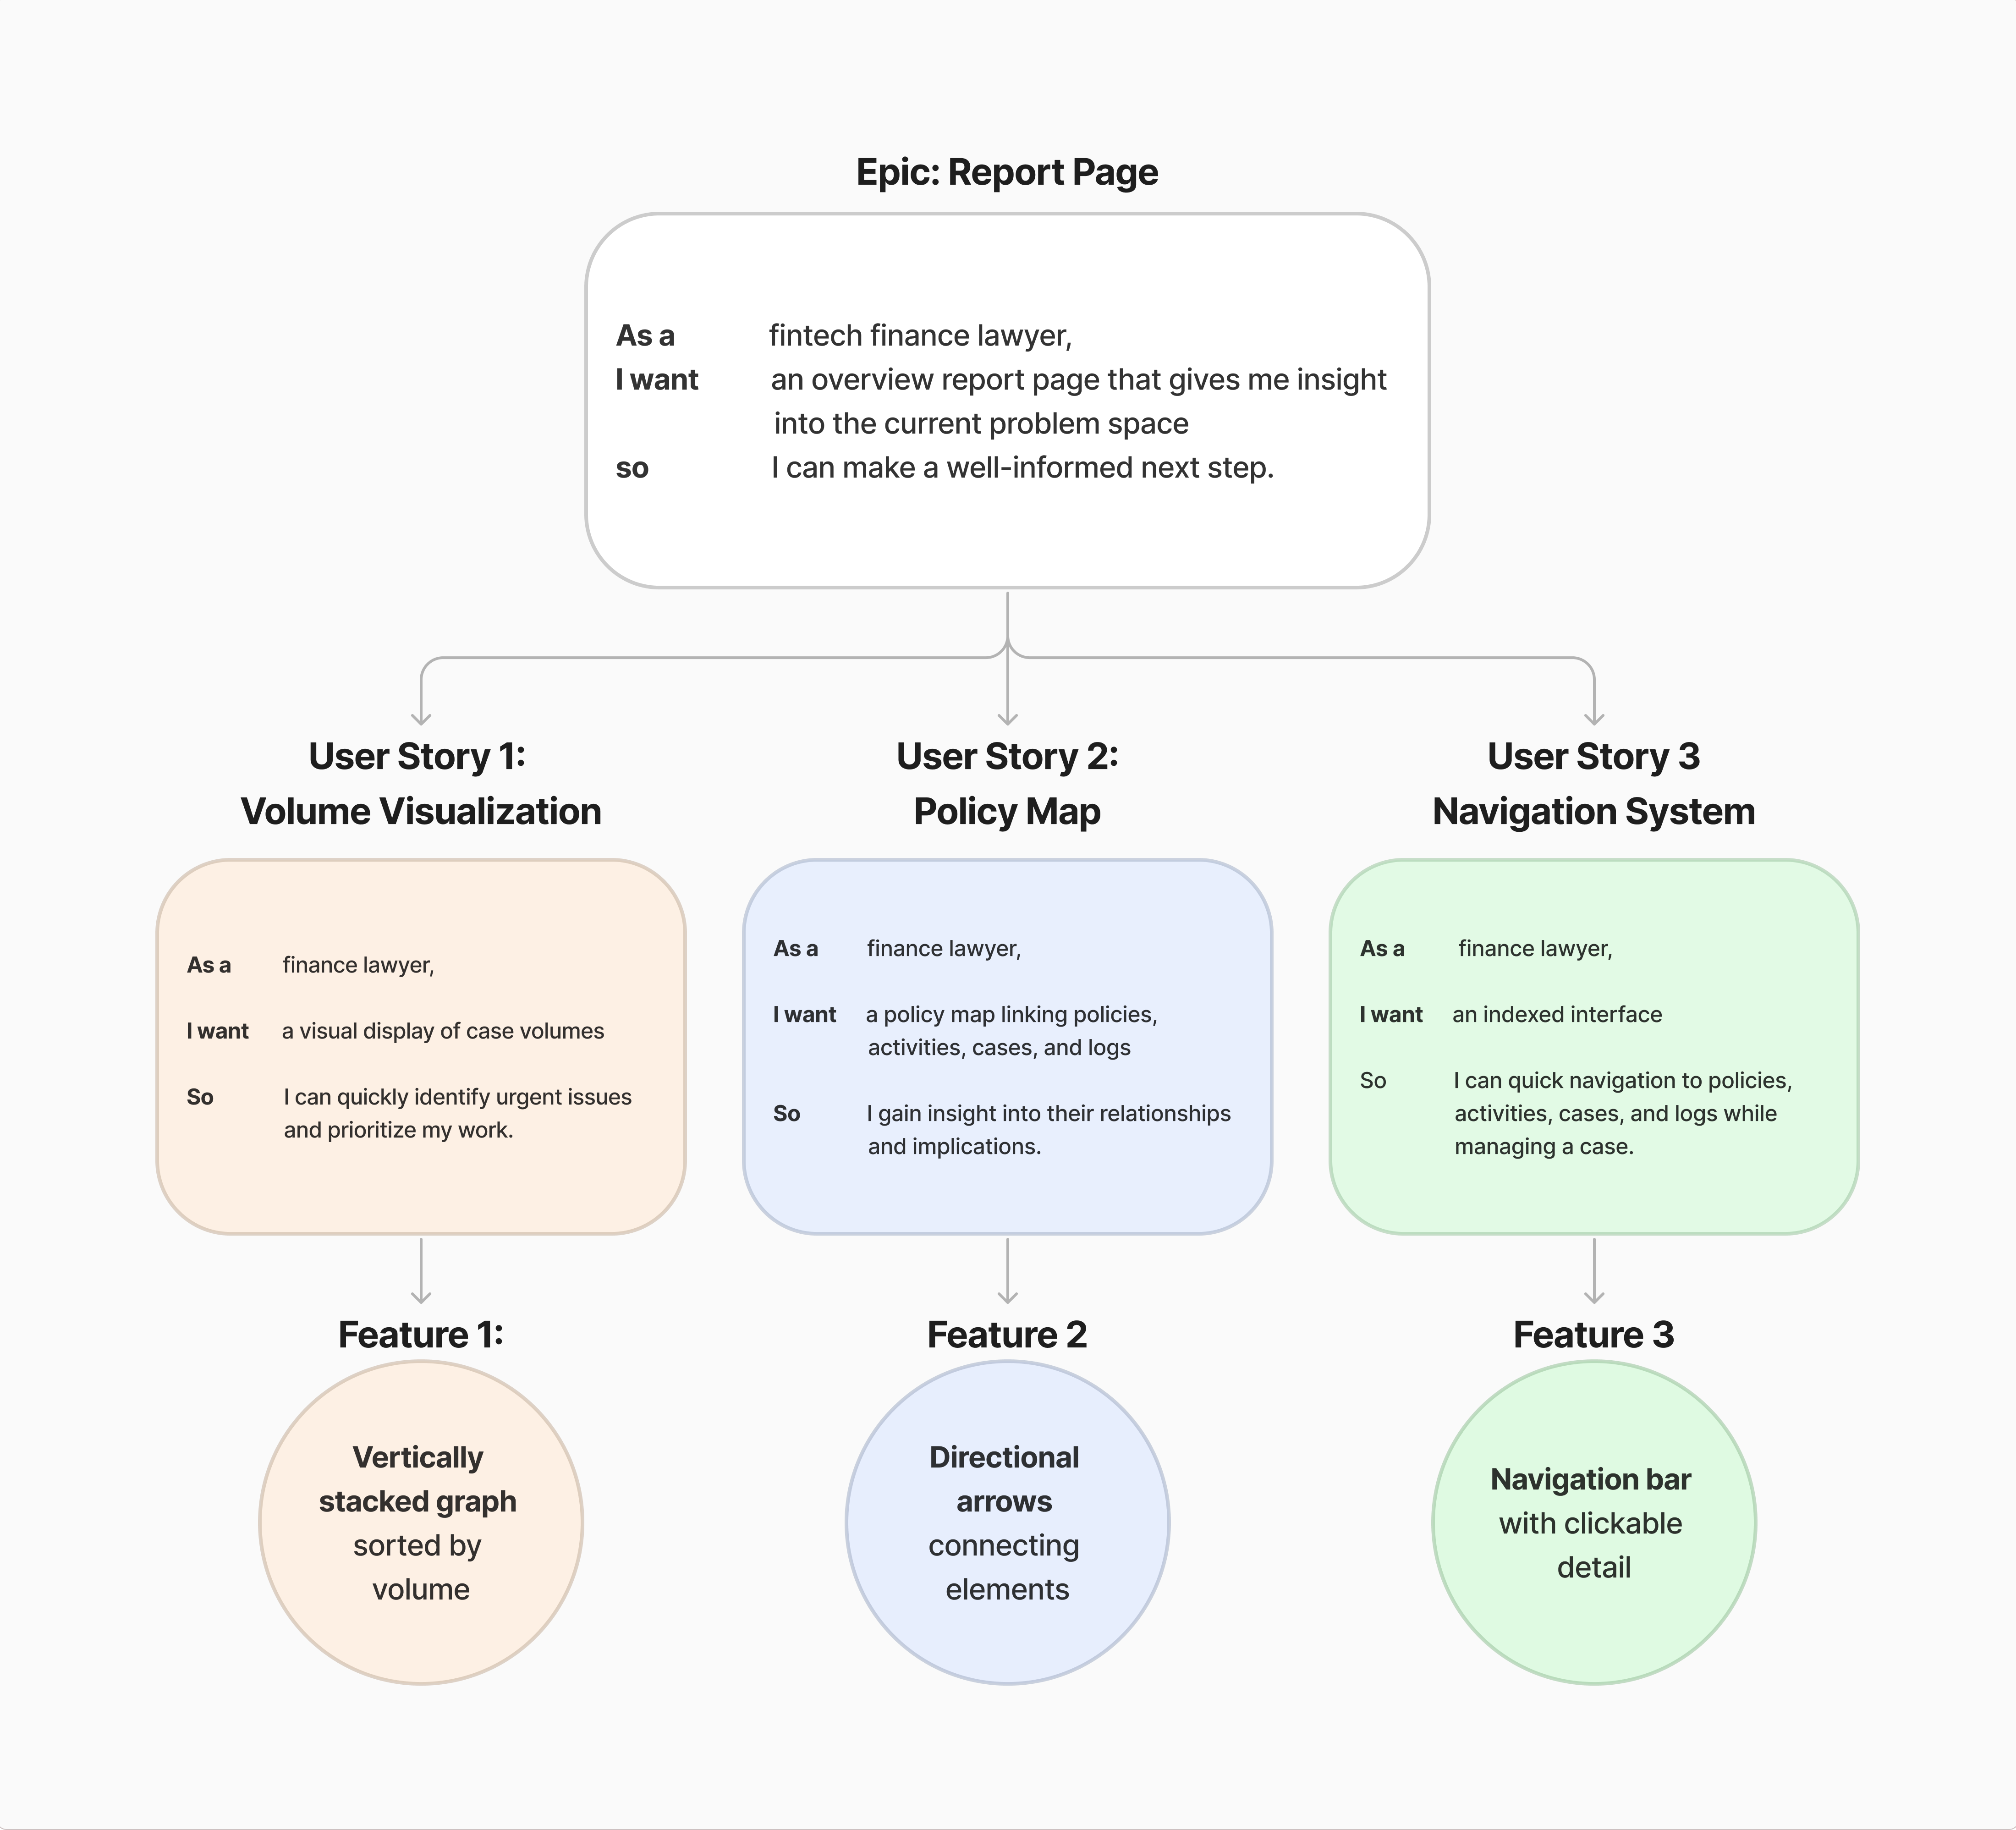
Workload Insight: A clear visualization of the volume of each component to understand attention and workload distribution
02
Cause-and-Effect Clarity: An intuitive way to visualize how different components influence each other
Clearer Organization
Visualizing information architecture and causal relationships
Volume visualization
Volume visualization
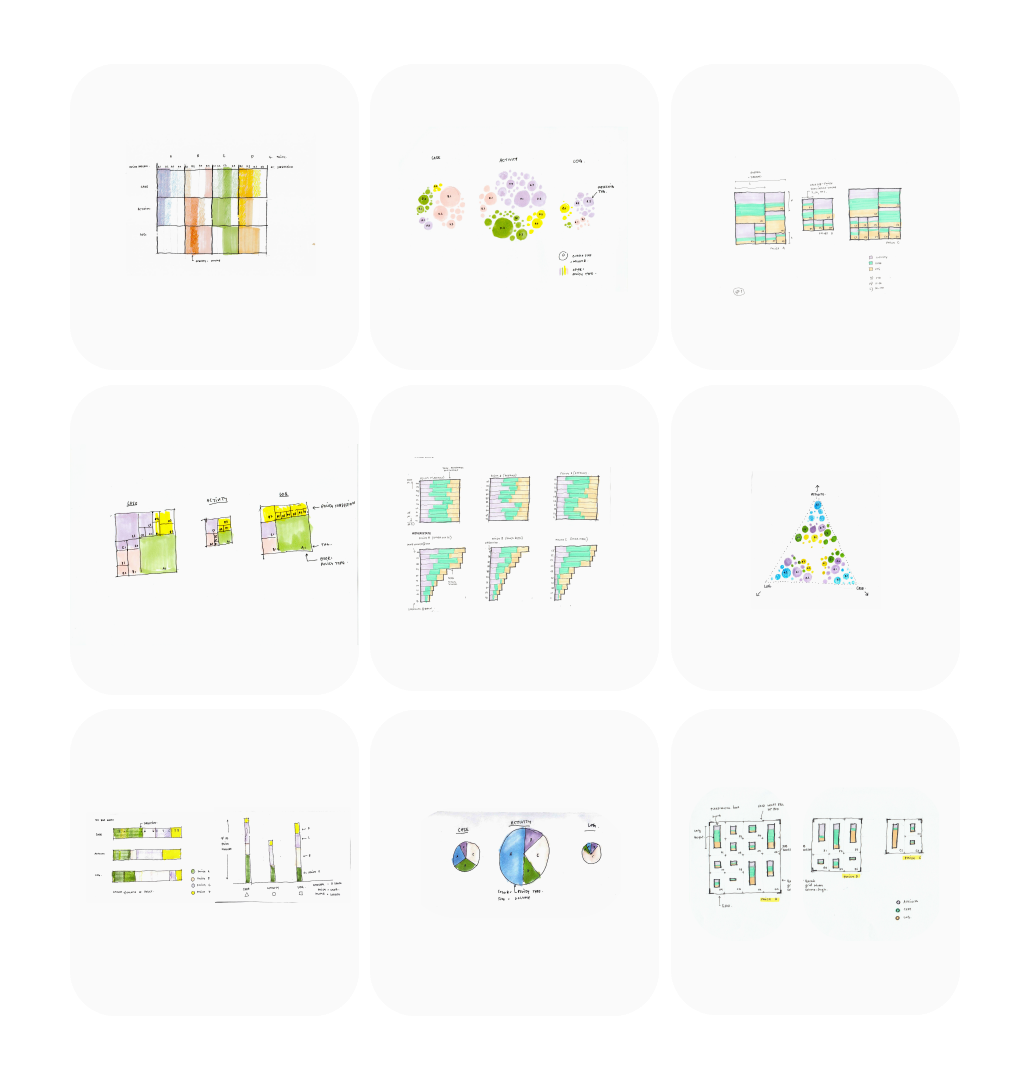
Organizing and representing data based on volume and categories
Organizing and representing data based on volume and categories
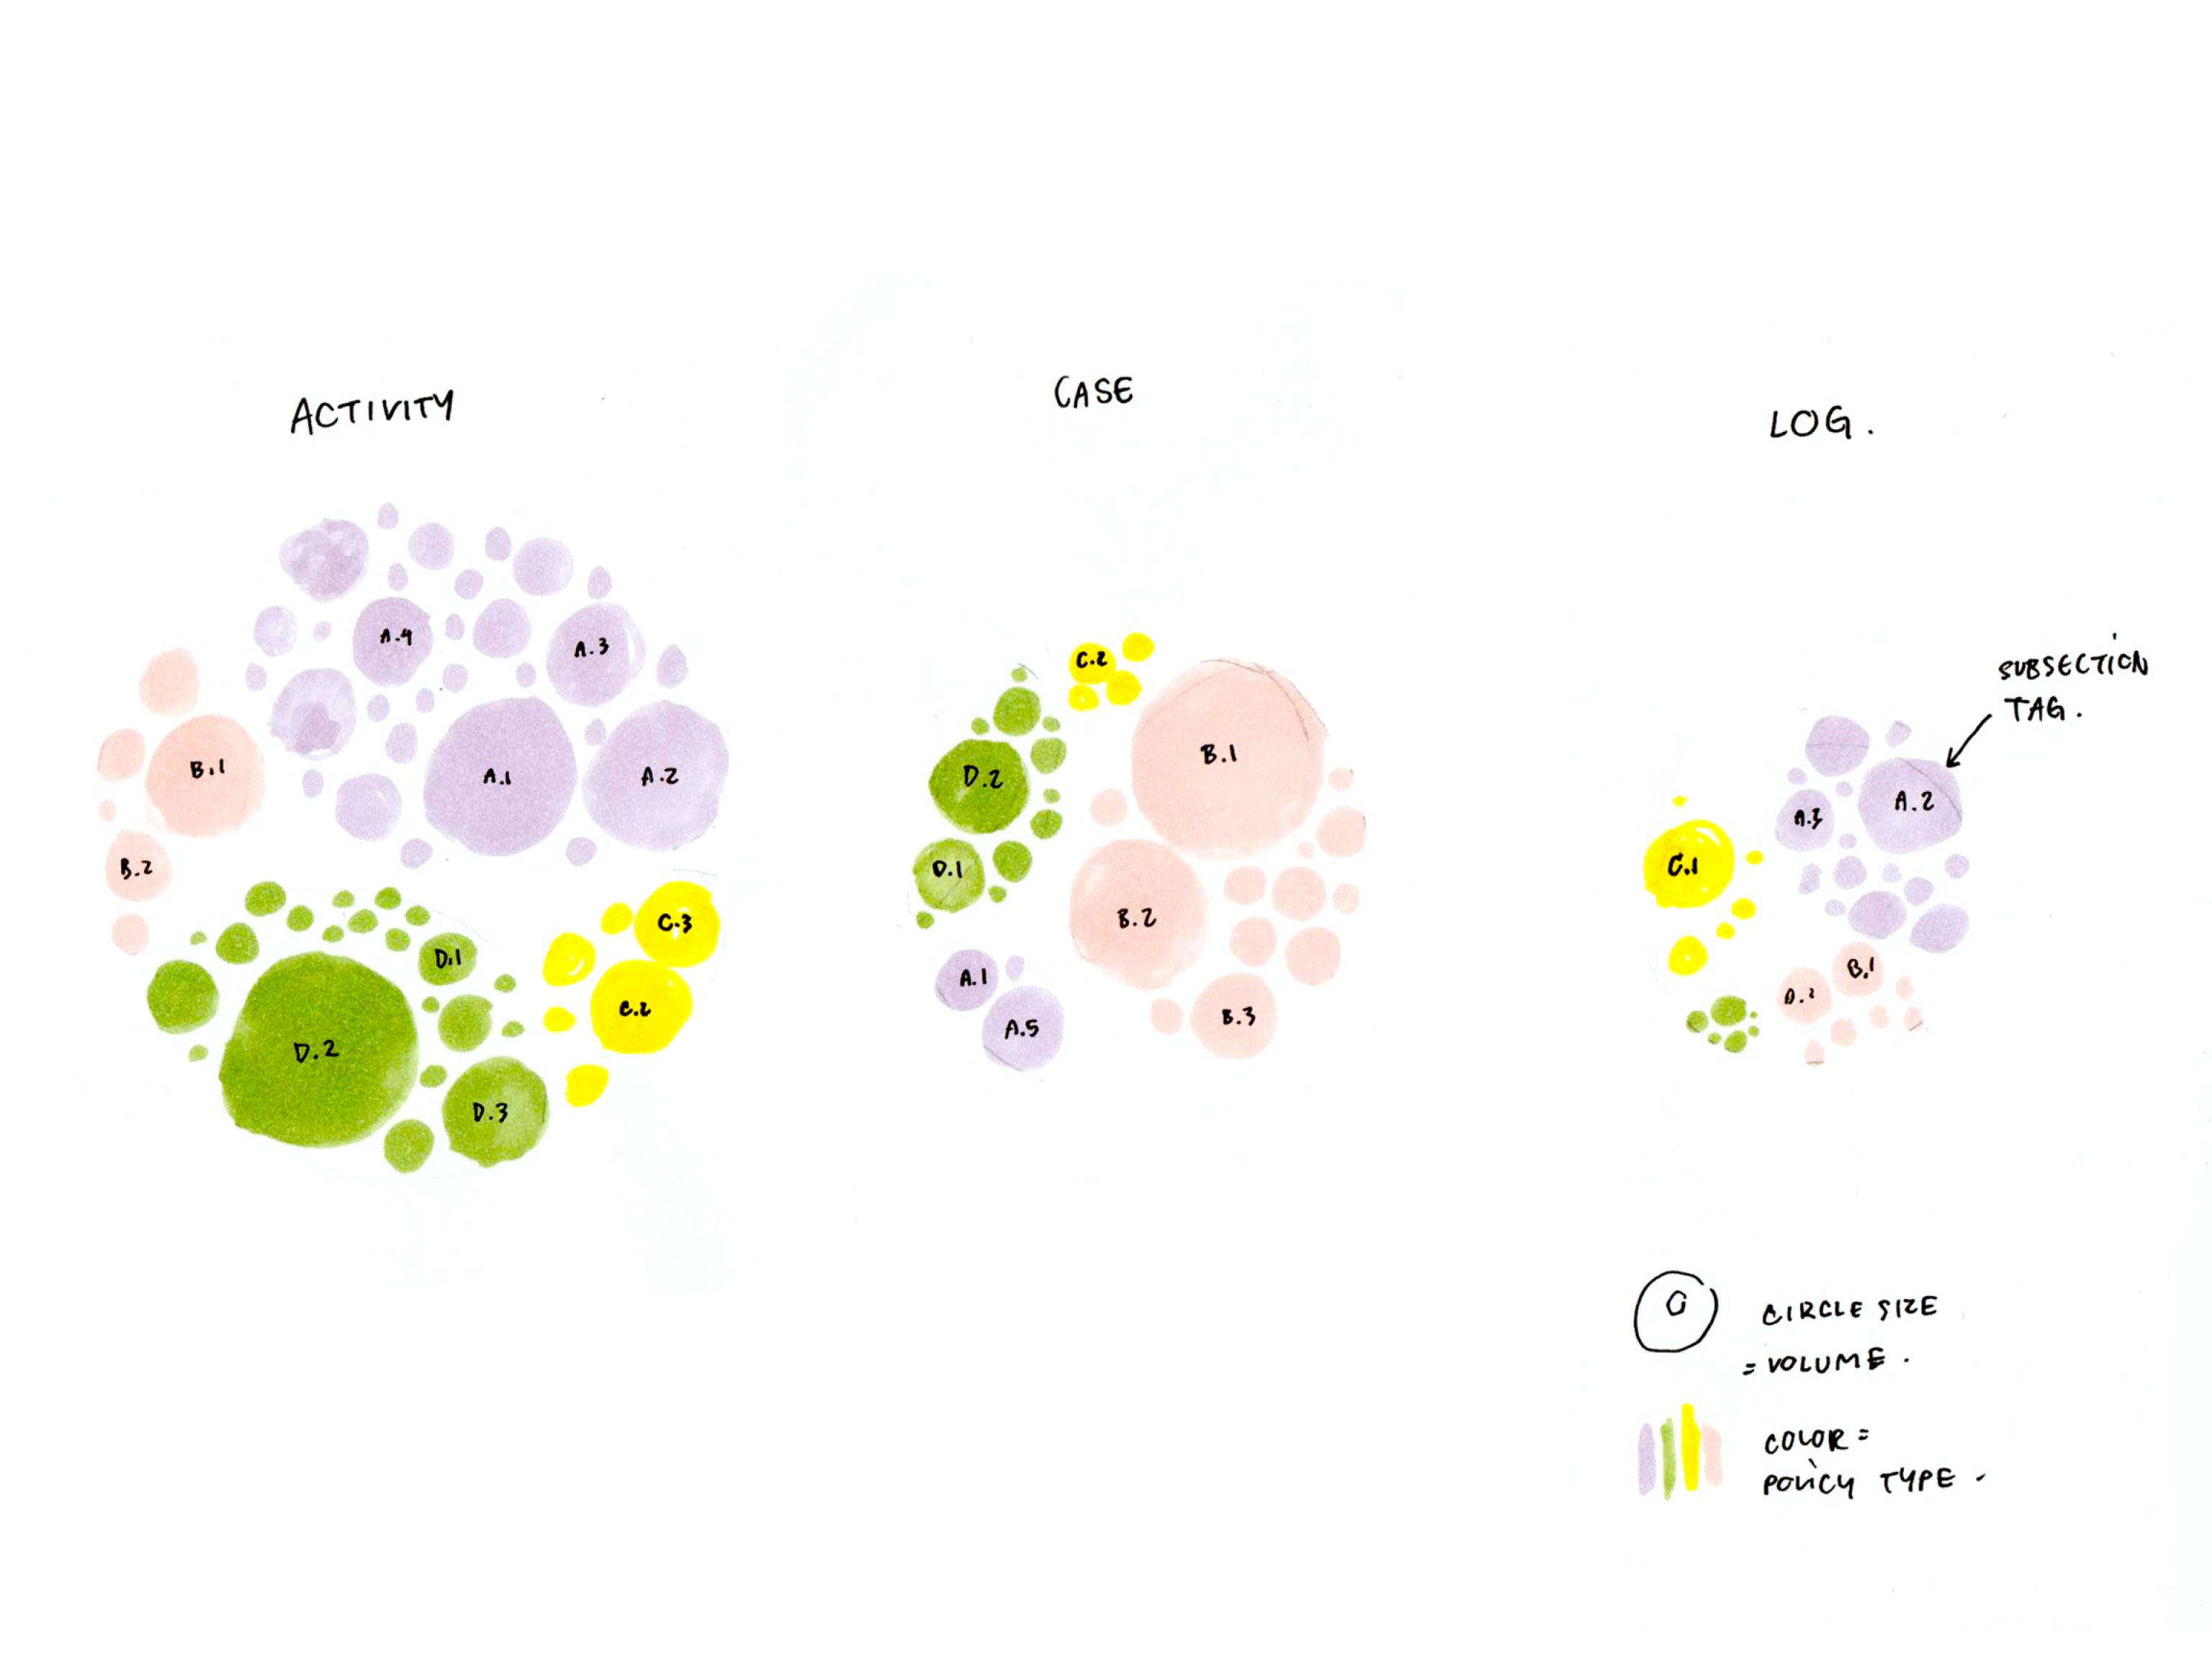
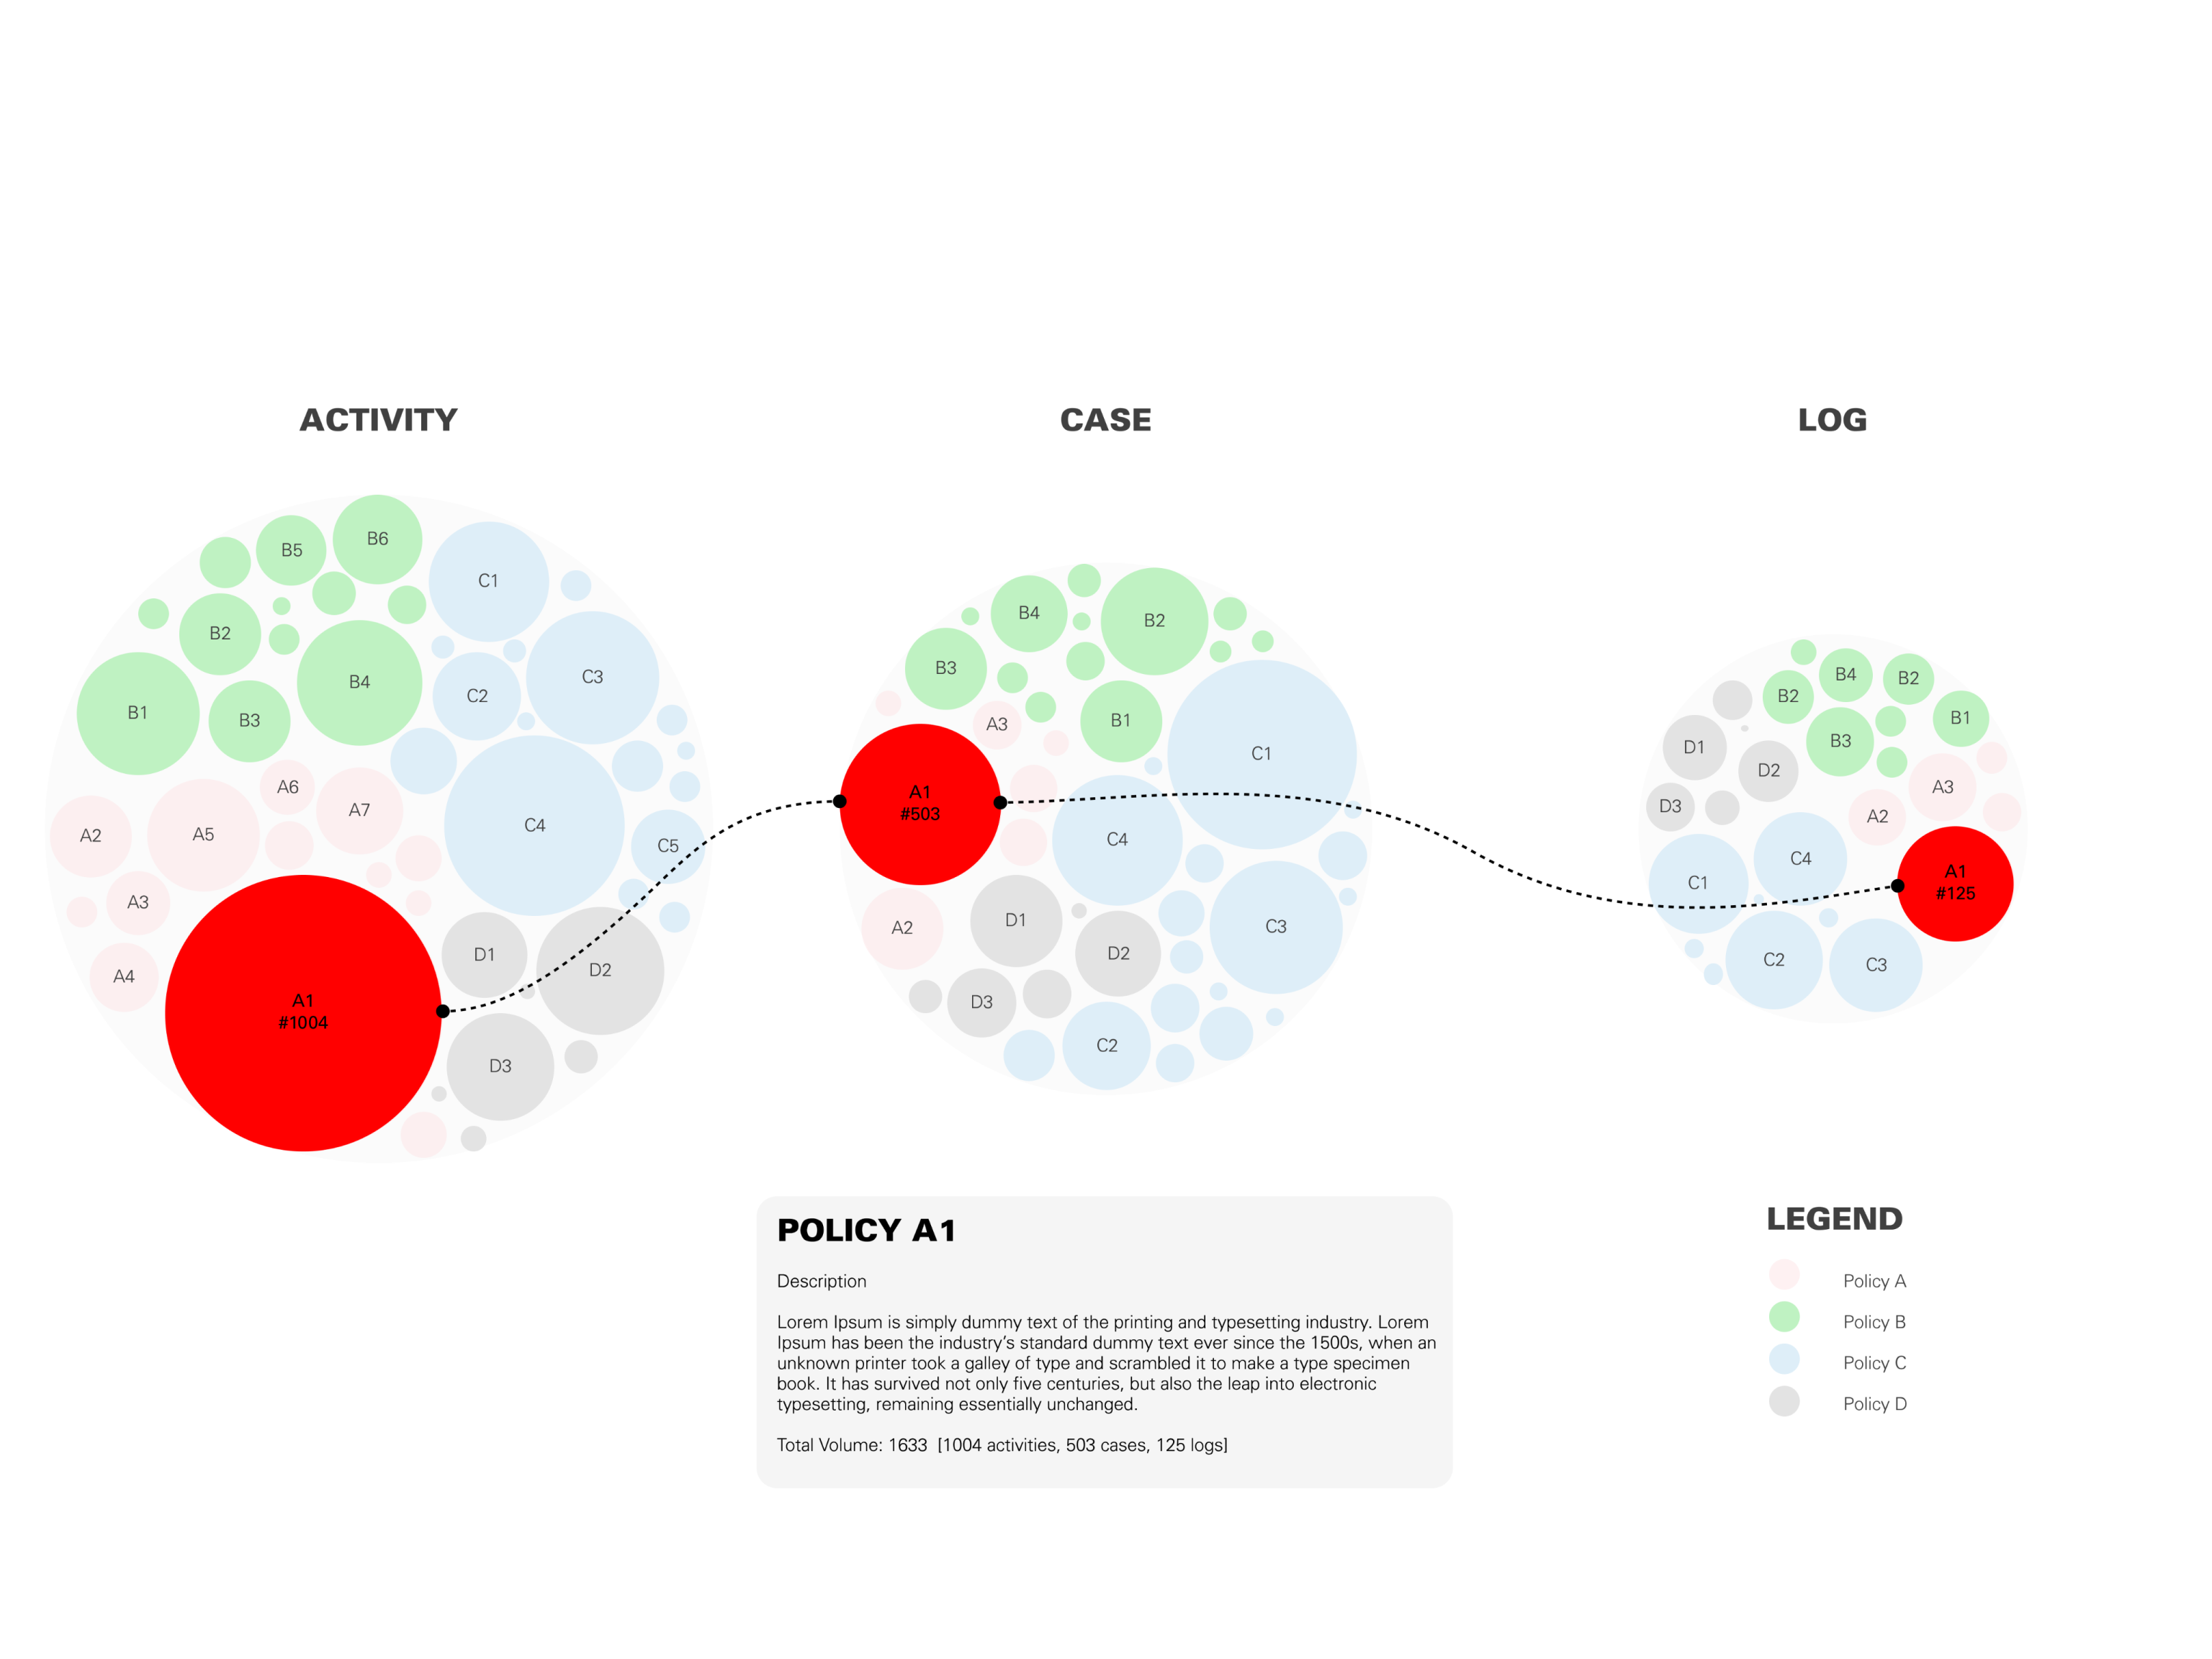
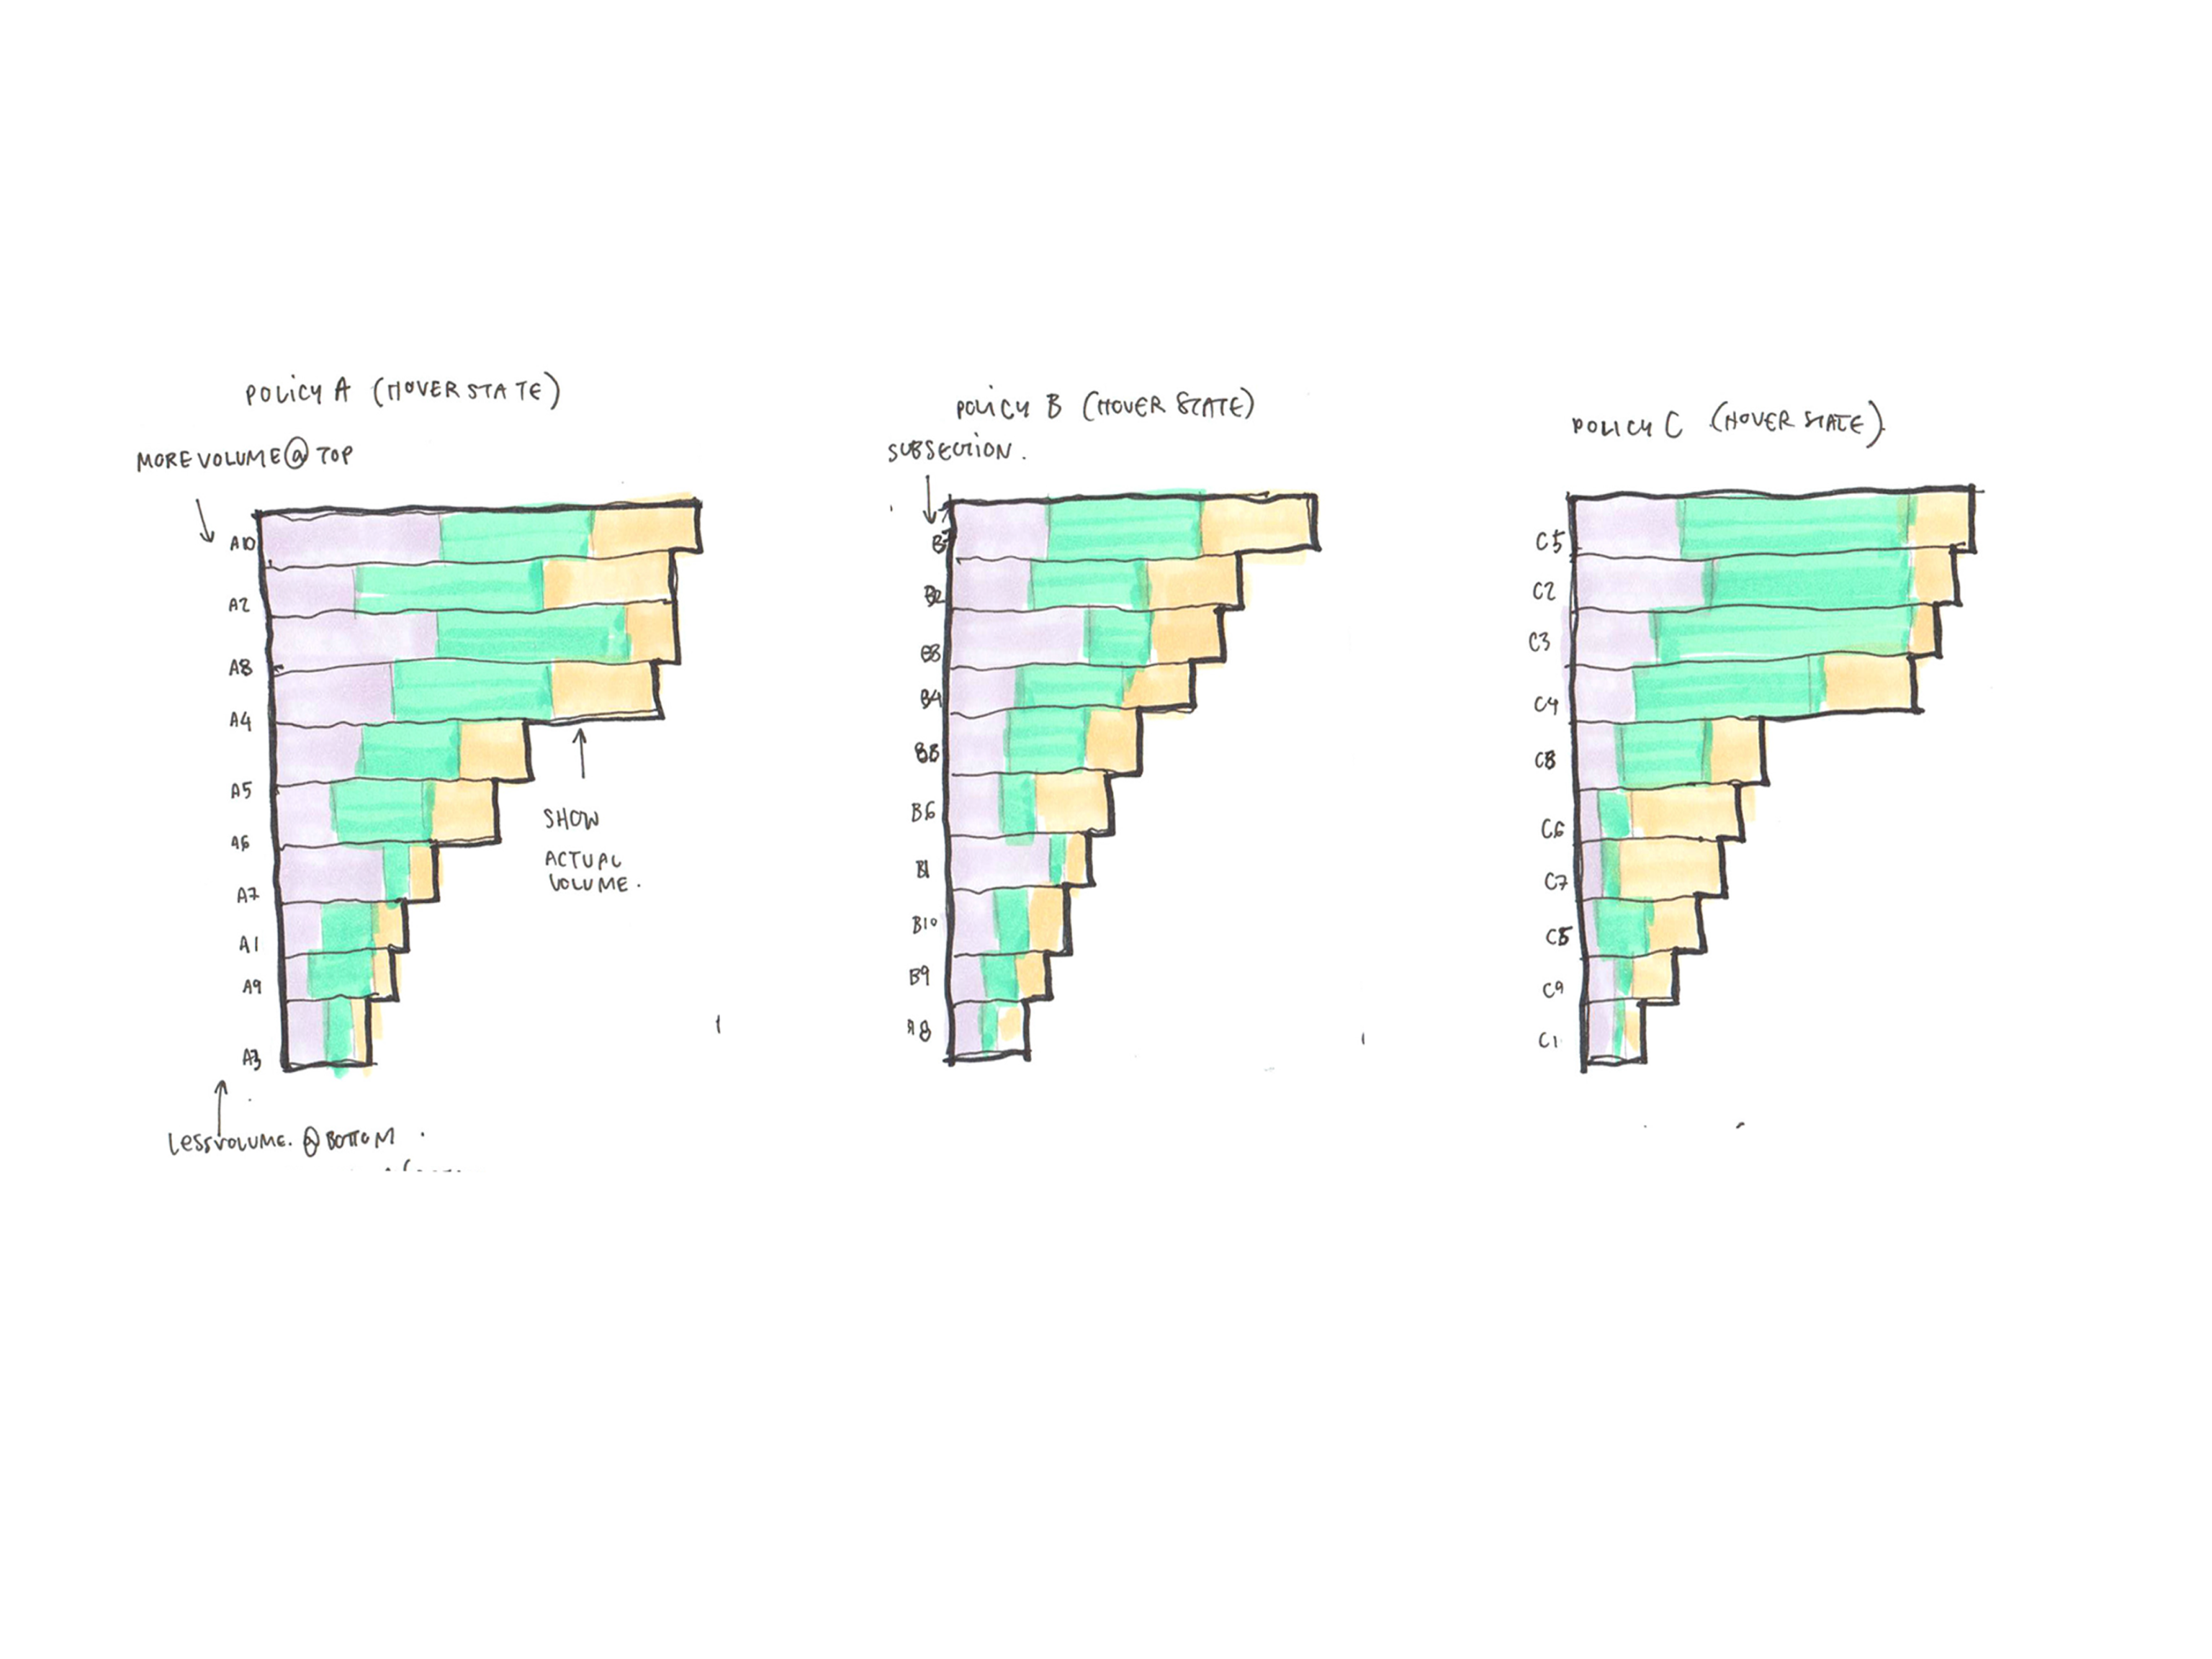
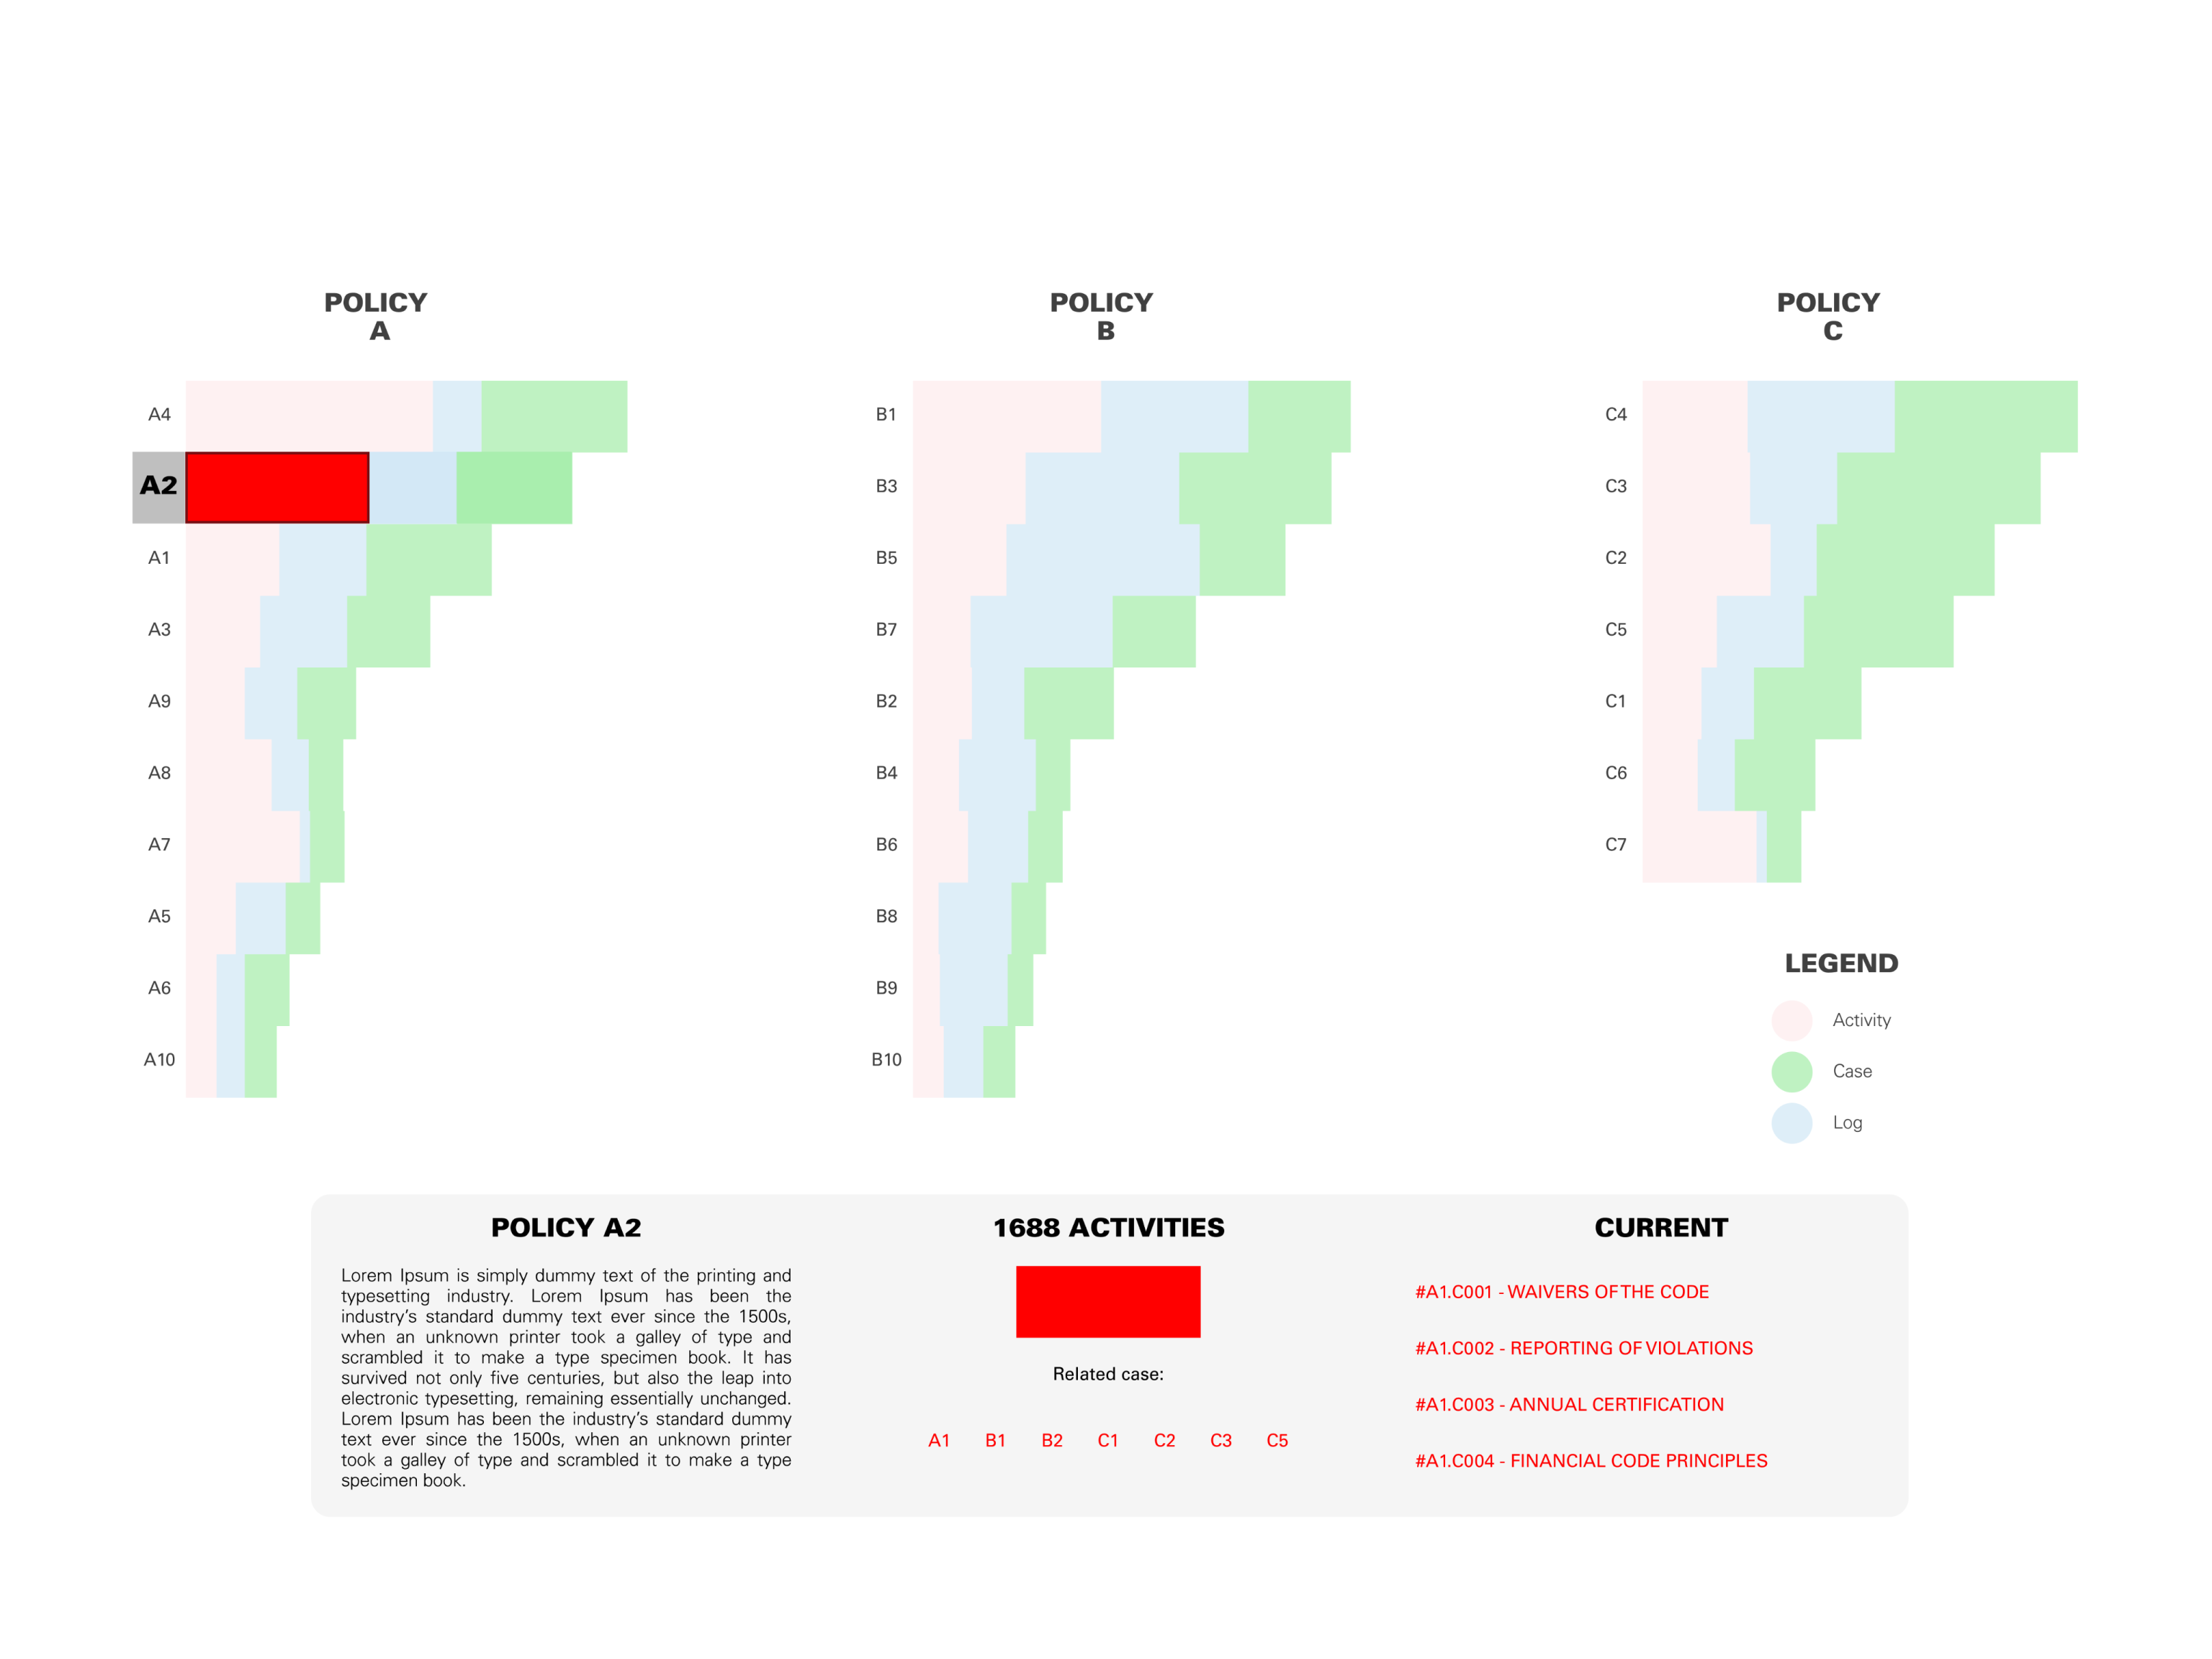
One page experience
One page experience
Designing for scalability:
Future-proofing growing datasets and relationships between elements for easy comparison, all on a single page
Designing for scalability:
Future-proofing growing datasets and relationships between elements for easy comparison, all on a single page
Shift navigation to a bottom panel for improved touch accessibility
Shift navigation to a bottom panel for improved touch accessibility
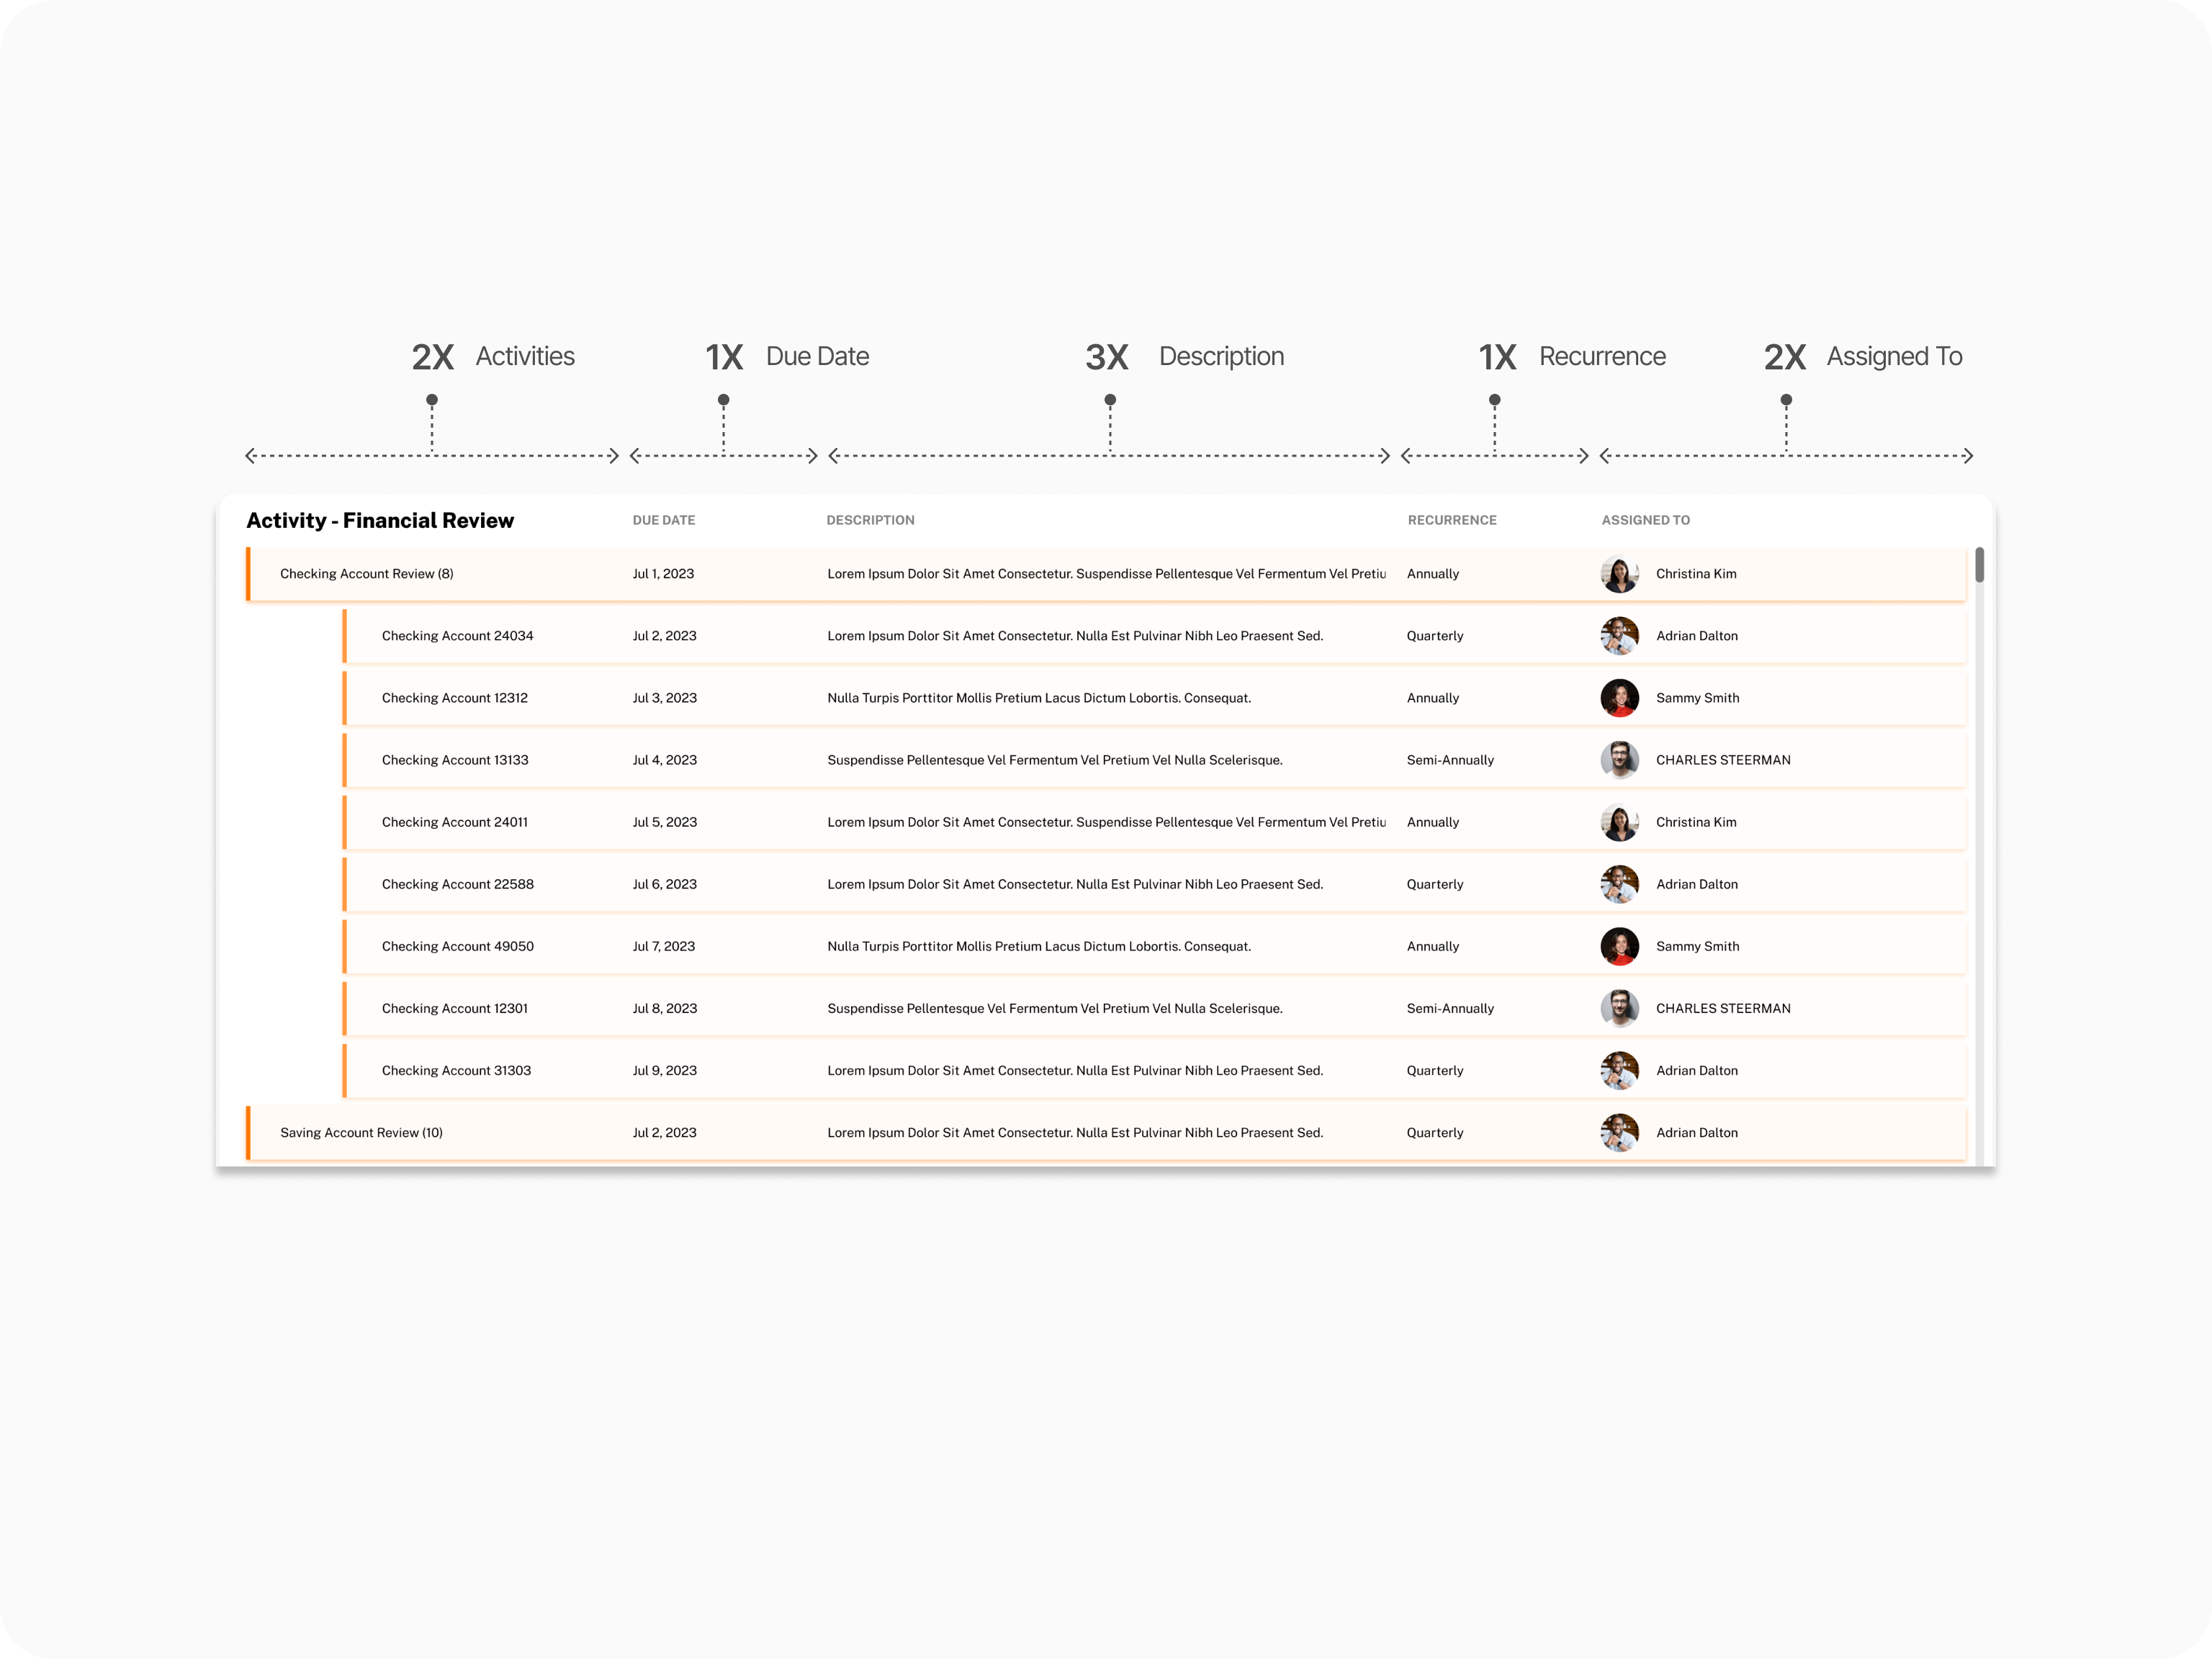
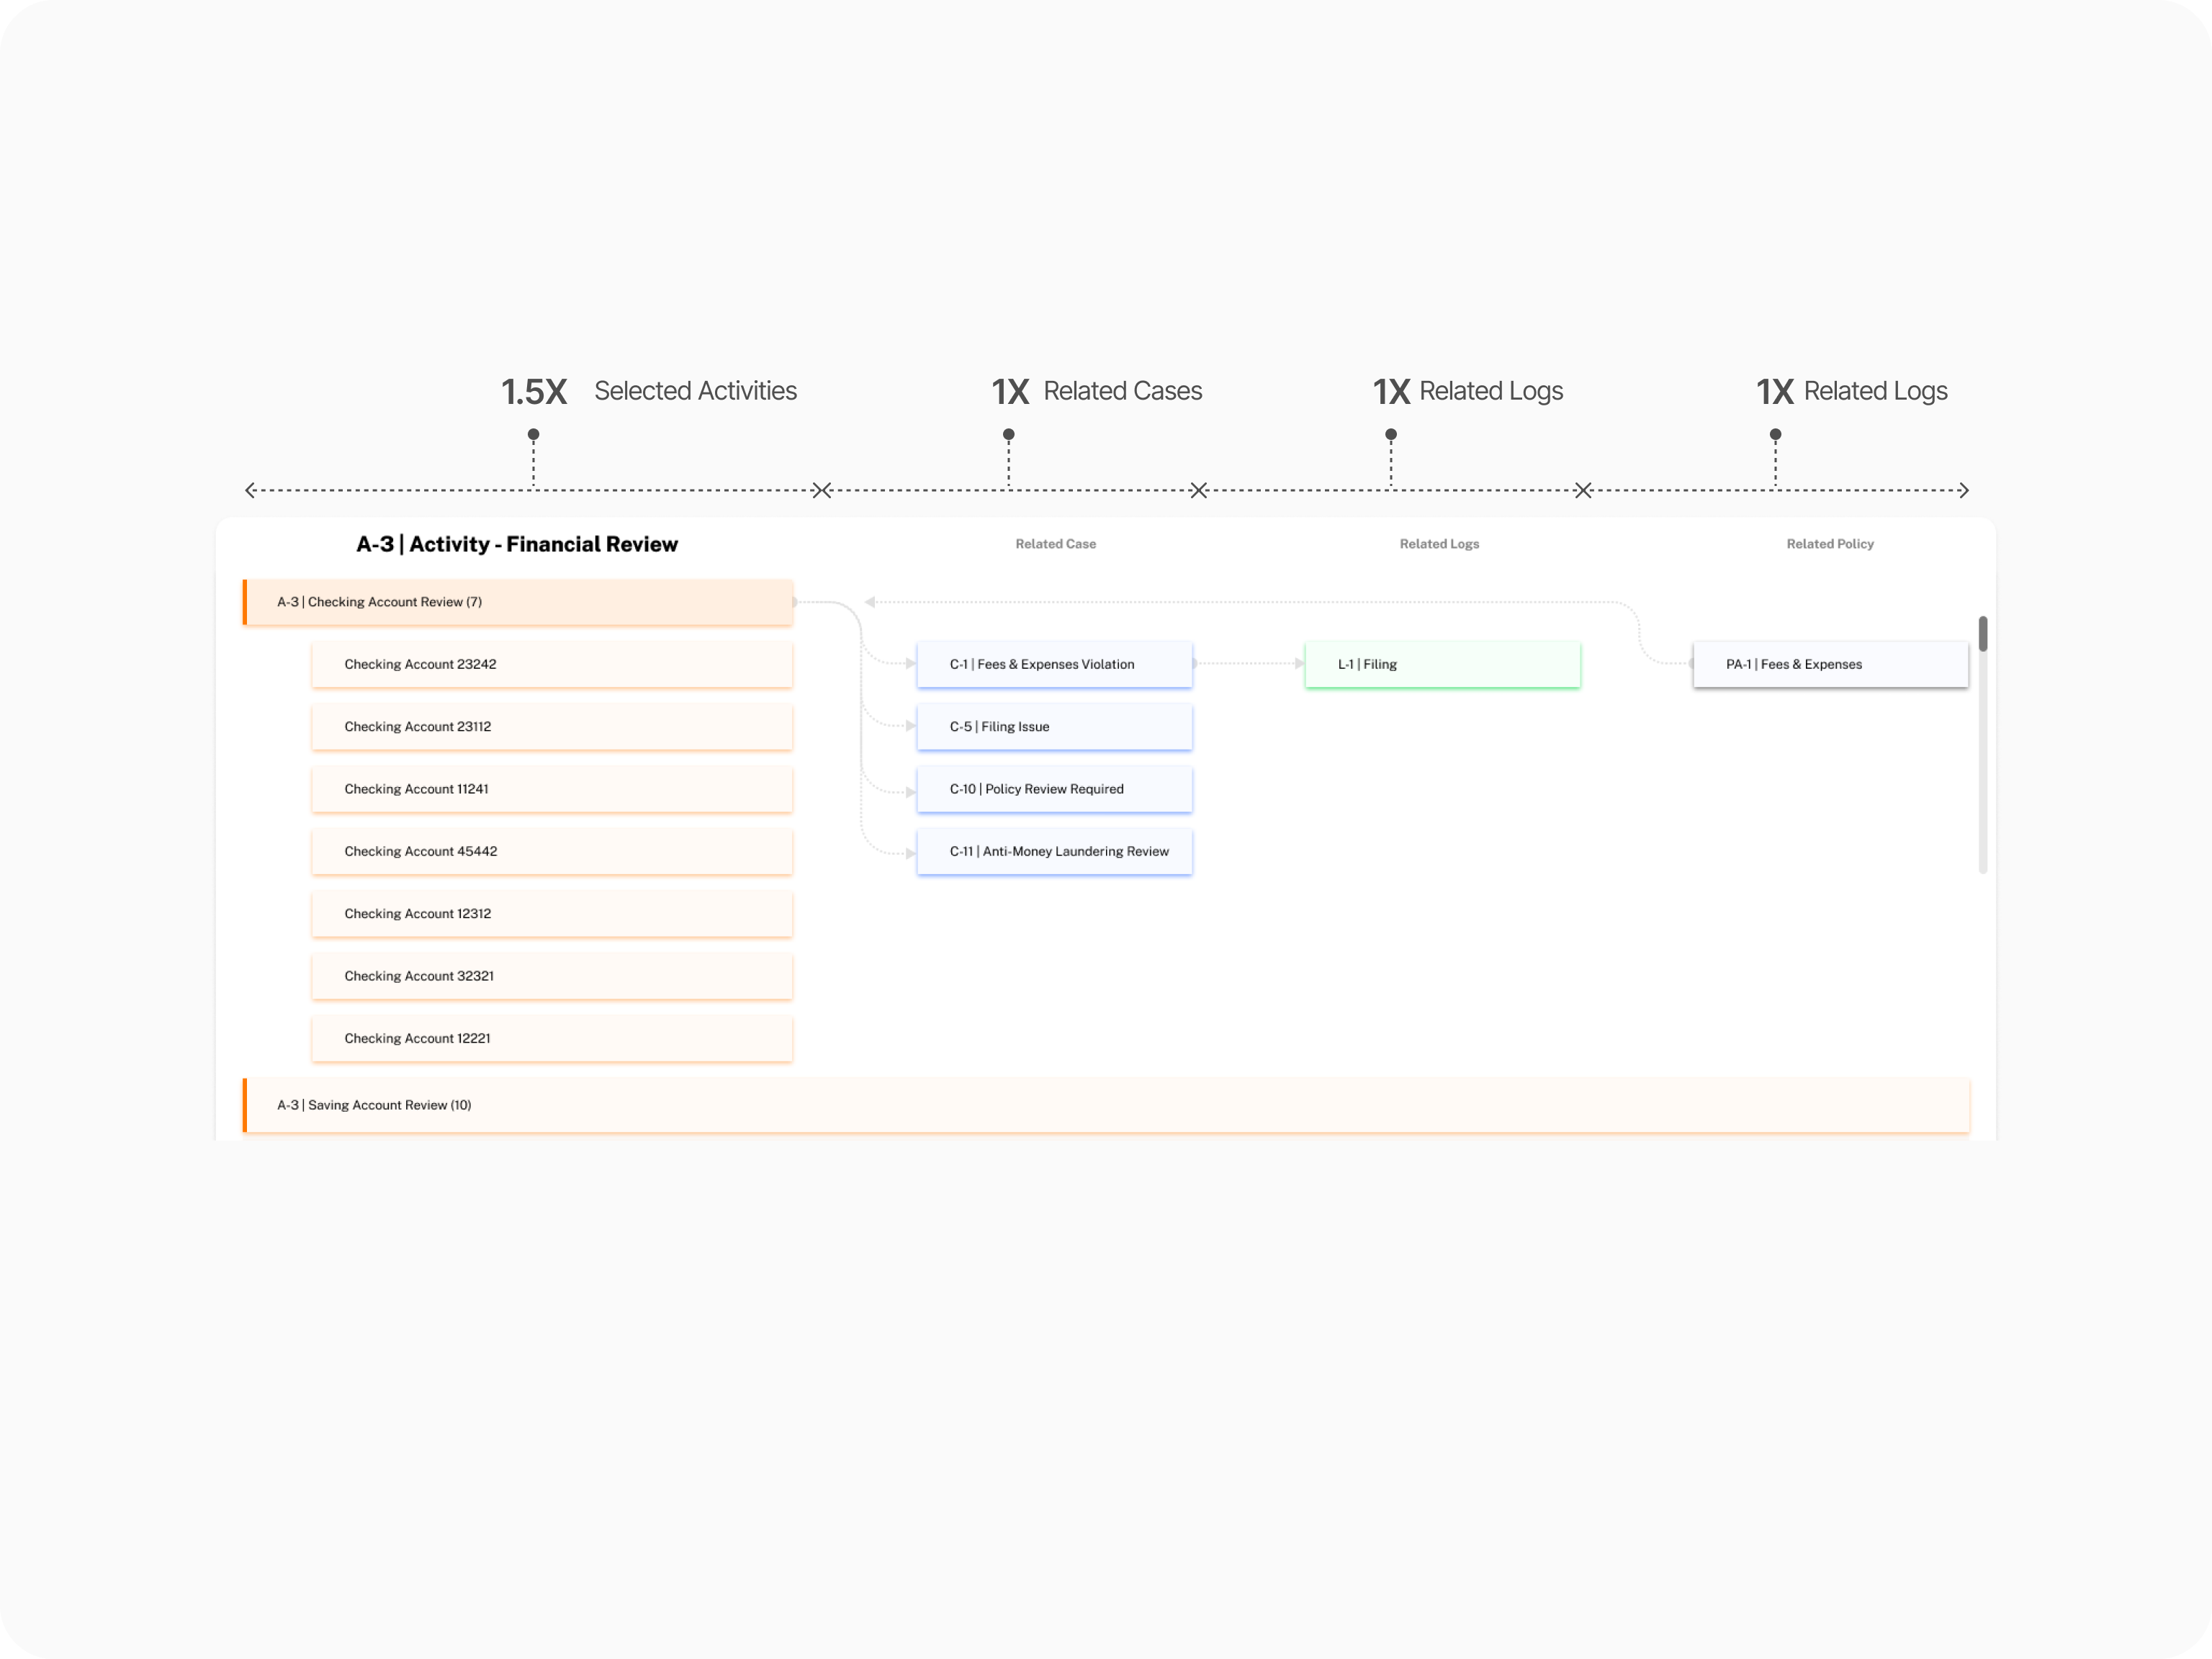
Reduce cognitive load
Use a hover-based legend to declutter the interface
Reducing cognitive overload with hover interactions to reveal the legend key
Linking the diagram and navigation bar for seamless exploration
Thank you
